The Largest Magnetic Storm on Record...or is it?
Analysis of large historical space weather events improves our knowledge of the potential hazards posed by the solar activities to modern technology. In 1859, two magnetic observatories in London simultaneously recorded magnetic field variations in response to one of the largest-ever known geomagnetic storms onto photographic paper: the Carrington event on 2nd-5th September along with its precursor event on 28th-29th August that year. The presence of two independent observatories recording this extreme space weather event in the same city (Kew and Greenwich) offers a unique opportunity to produce a cross-validated set of historic magnetic field variations. BGS produced the most complete correctly timed and scaled digitised magnetic field data to date from these archive paper records, and presented them in the publication Digitized continuous magnetic recordings for the August/September 1859 storms from London, UK (2024) - at present, one of the most read articles in the journal Space Weather.
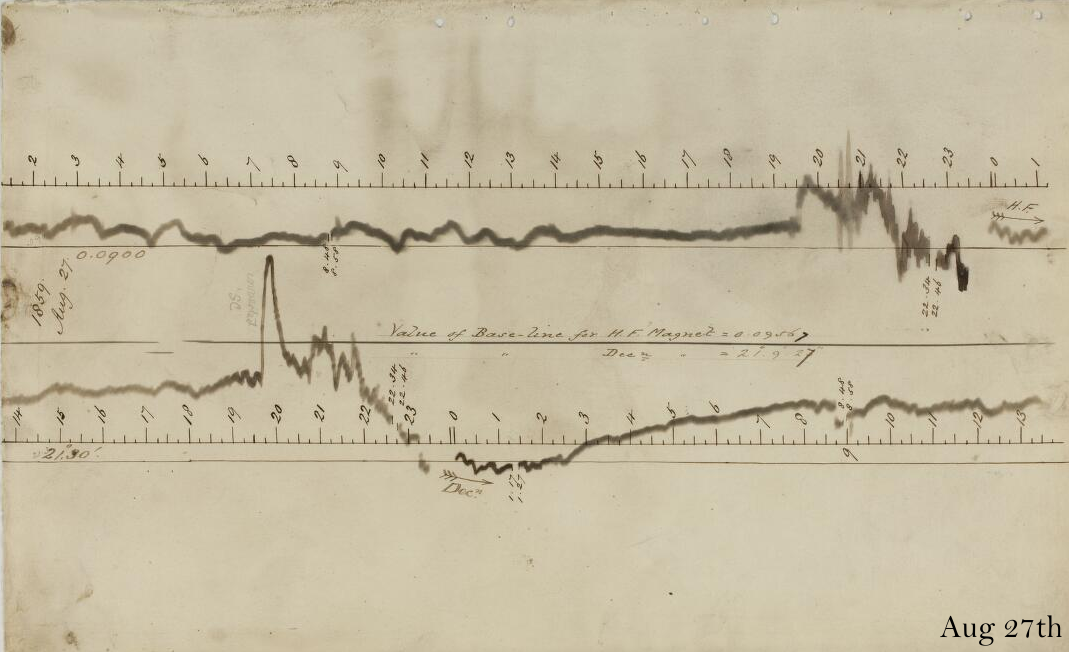
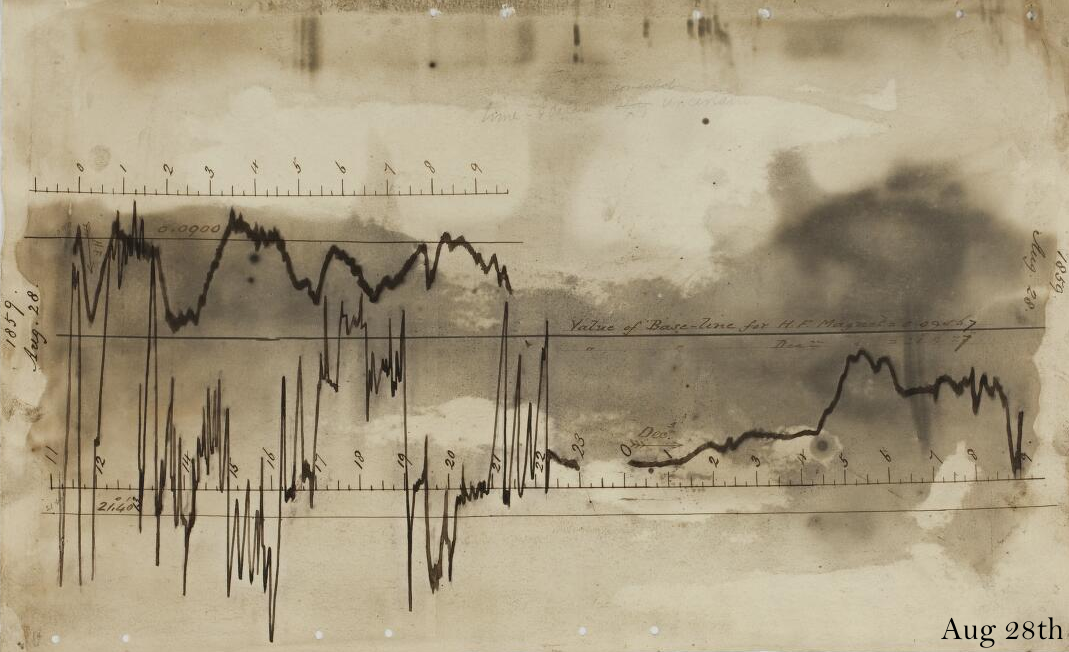
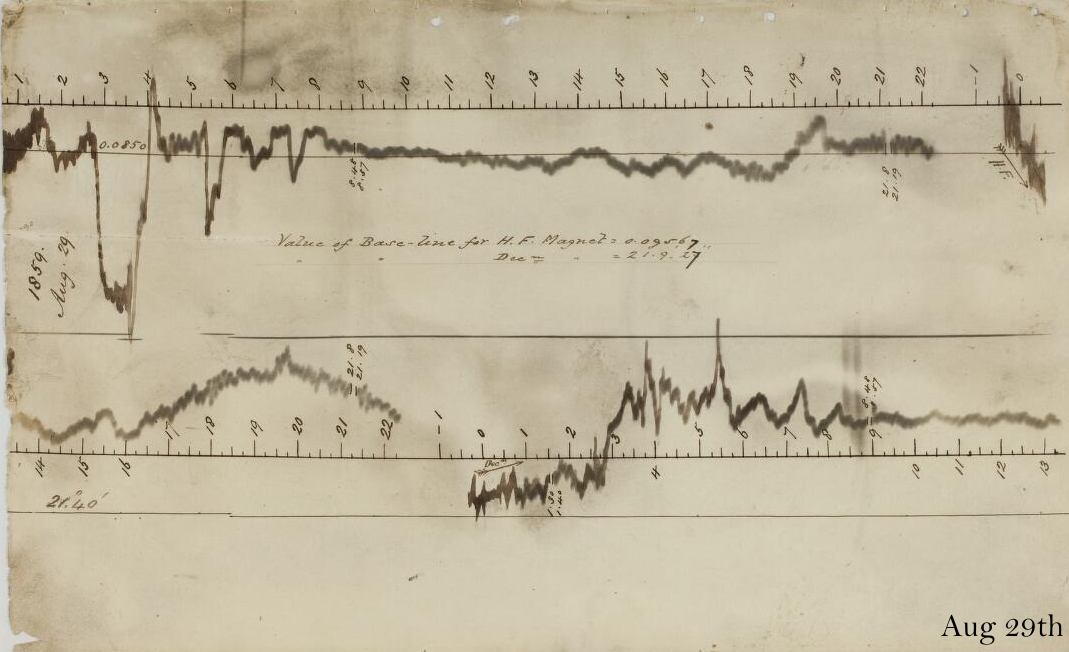
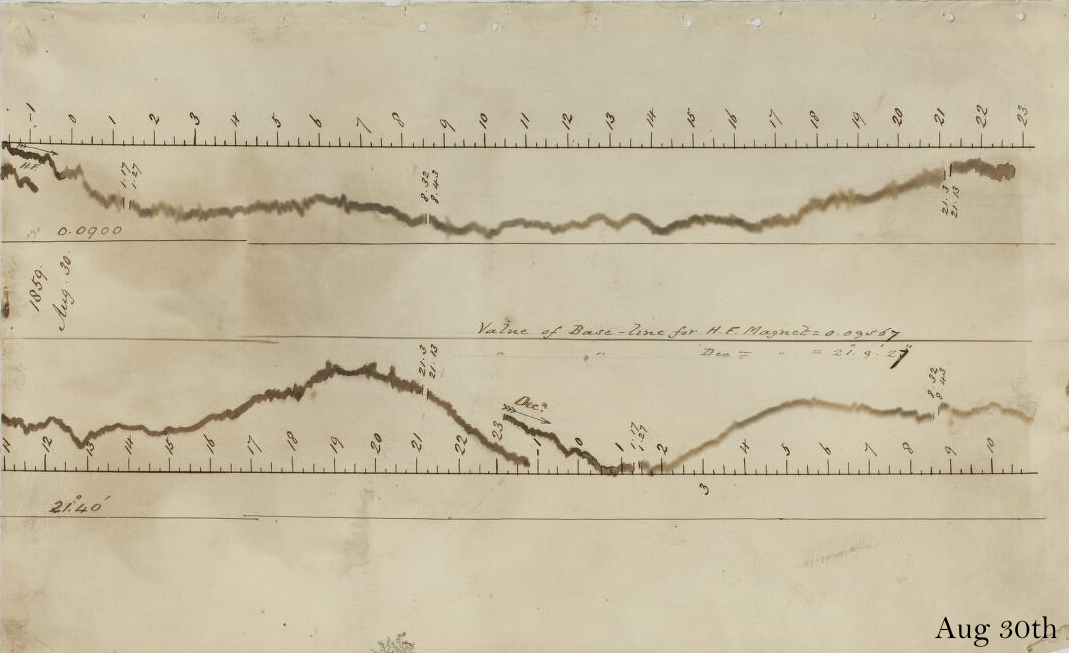
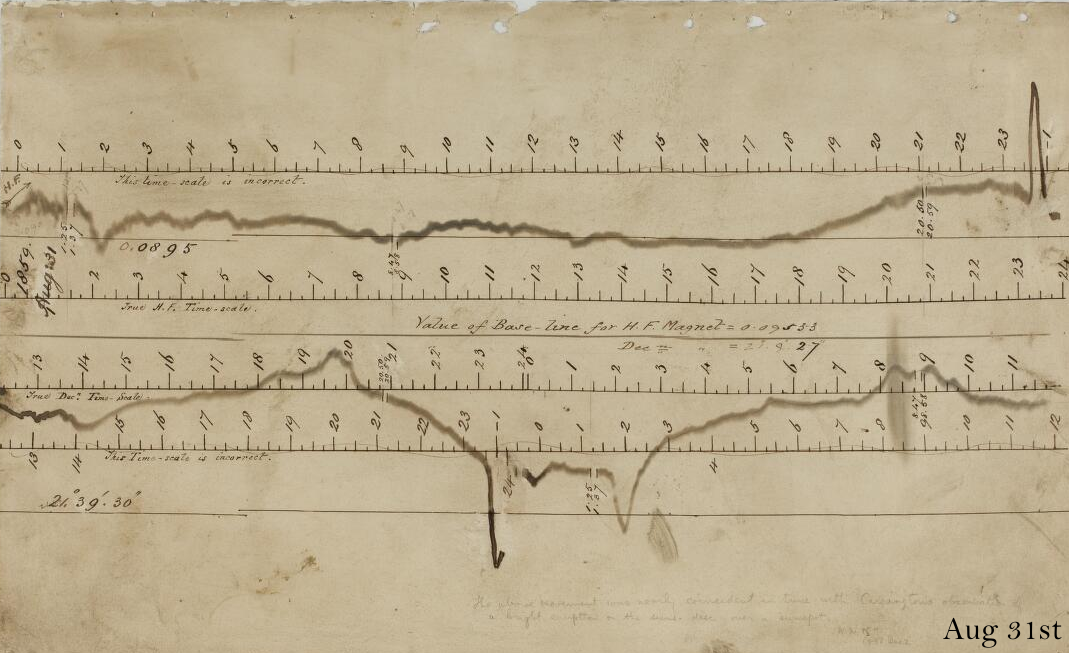
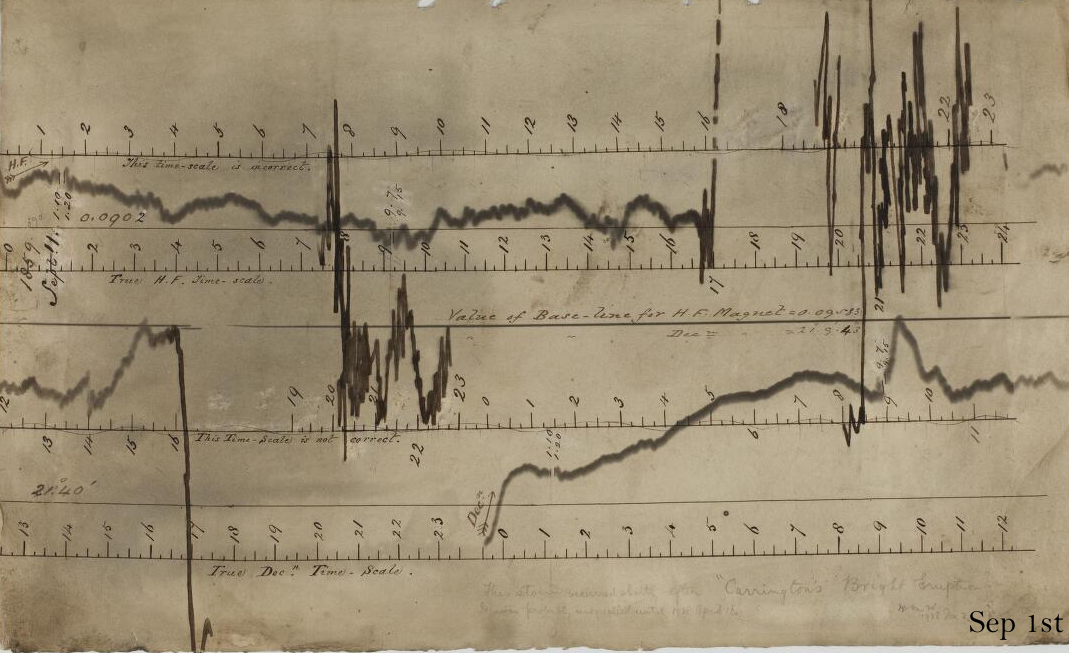
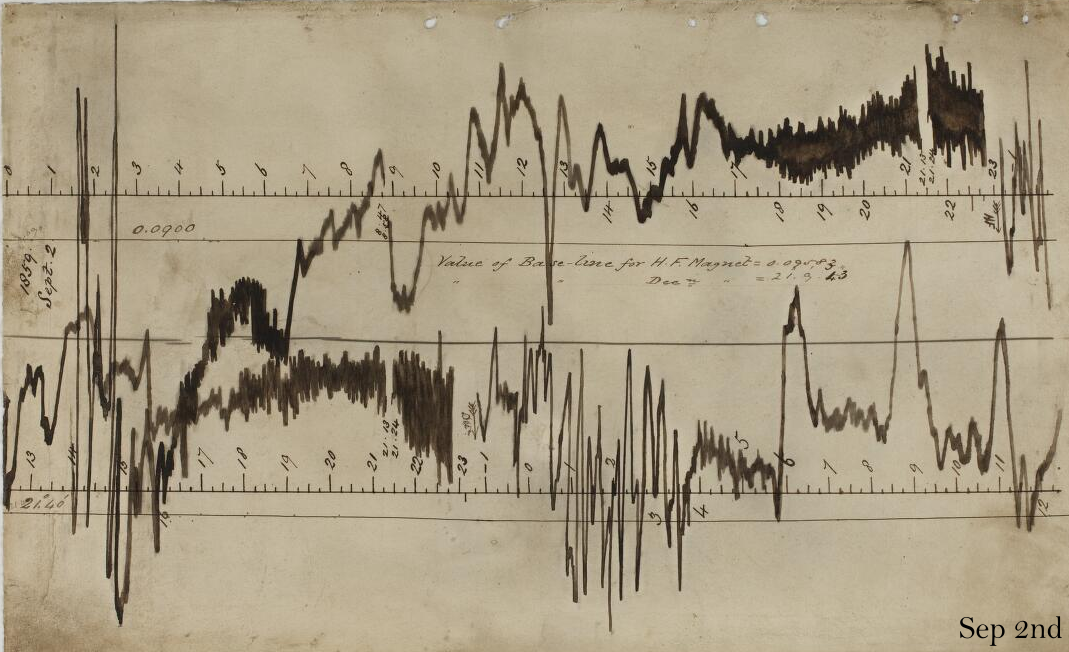
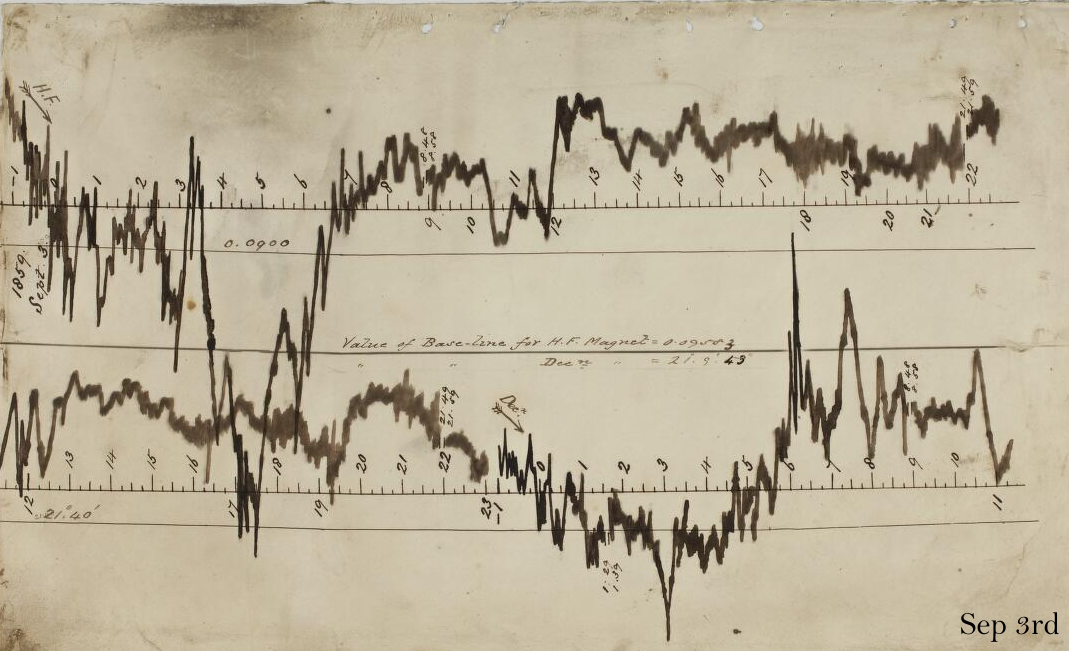
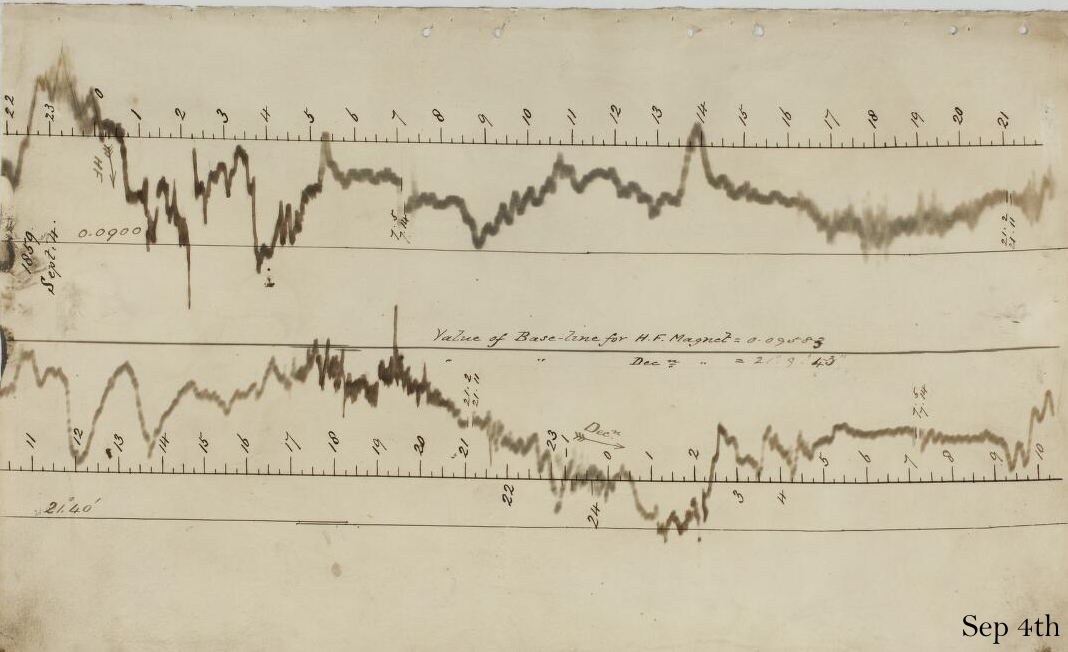
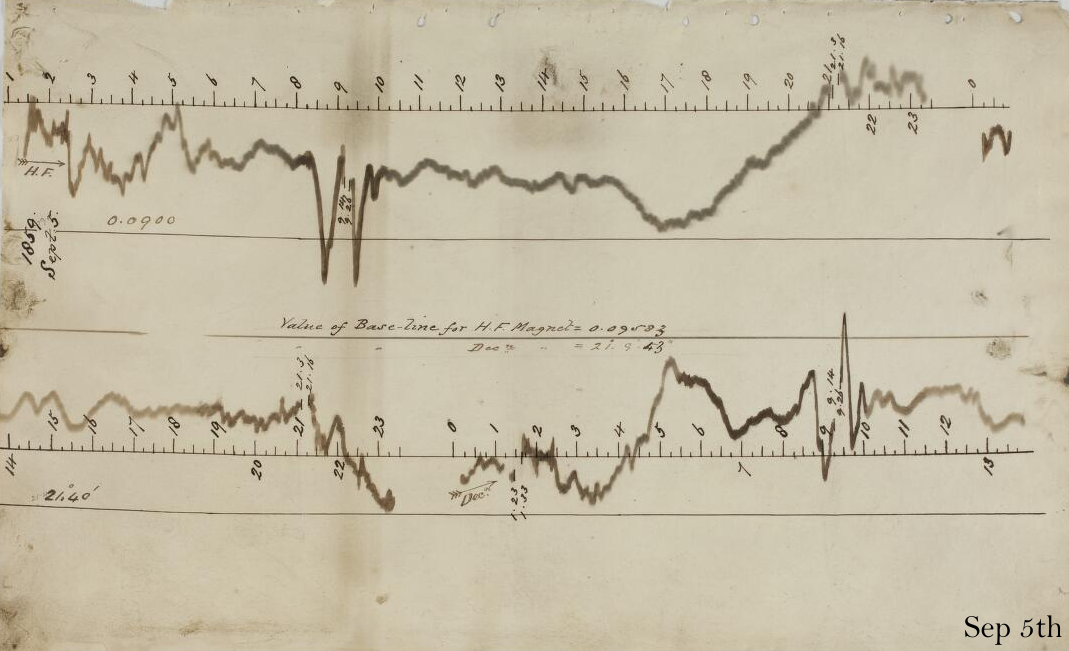
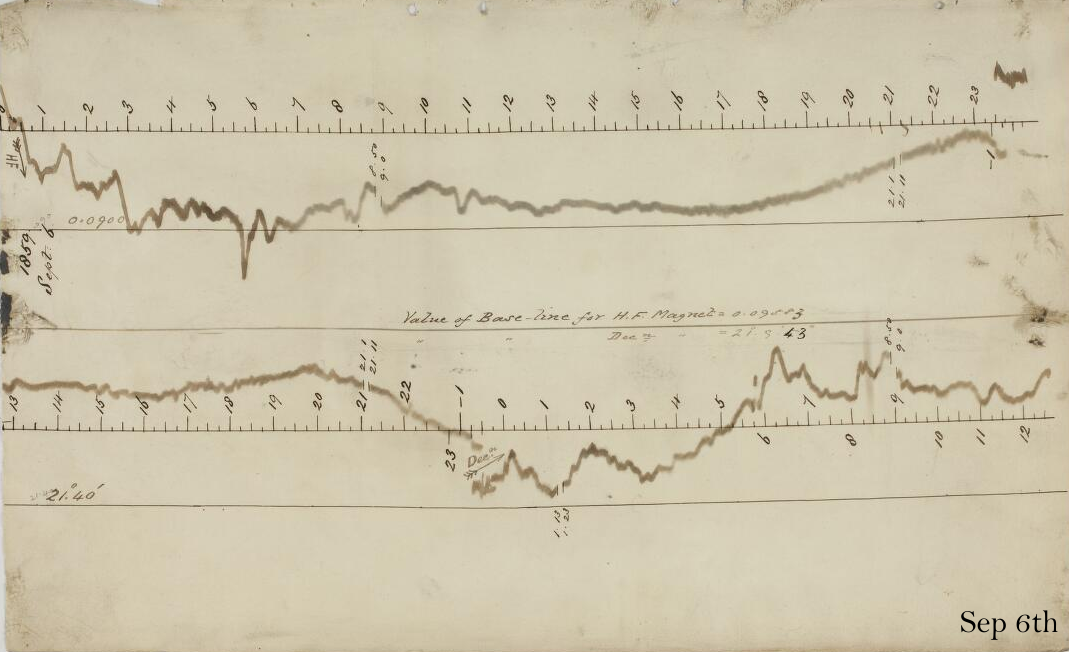
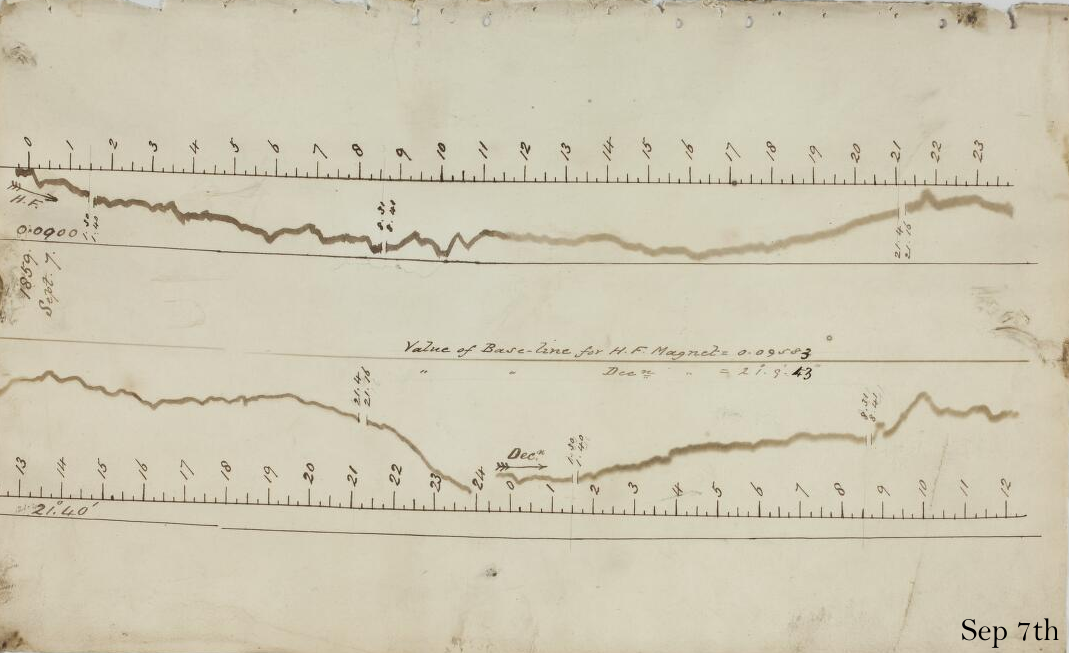
The 'Carrington Event' of August 27th to September 7th, 1859 - recorded at Greenwich Observatory, London
Declination, or compass direction, (D) is the lower trace on each image and the horizontal force (H) is the upper trace. Universal Time is the time recorded here (astronomical) plus 12 hours and measured D precedes H by approximately 12 hours.
For reference the marked 'solar flare effect', beginning at 23:15 recorded time on August 31st, is at 11:15 Universal Time on September 1st. It has been measured as 110 nT in H and 0.283 degrees in D.
Please note that these timings are approximate and should not be regarded as definitive. Also note, the size and scale of each image is only approximately similar, day-to-day. Some data have also been lost, either due to ink and paper degradation, or because the variations were so large they were off-scale.
This is one example of the historical data contained in the British Geological Survey geomagnetic archives. We have photographed our complete collection of over 250,000 magnetograms, which are now available to view online.
Back to the top.